What is the most effective method for Raiders pregame analysis at Allegiant Stadium?

When you’re gearing up to cover or predict how a Raiders quarterback will perform, you can’t just read headlines. You need a systematic approach that blends recent NFL breaking news, live highlights, tape review, and statistical modeling—all tailored for the unique environment of Las Vegas Allegiant Stadium.
1. Understand the Context: Raider’s Season and Role
The first step is to frame the quarterback’s season in 2026. Look at his overall record, injury status, and any roster changes that could affect his play. Knowing whether he’s a starter or backup influences how much weight you give to game tape versus live highlights.
Key Context Questions
Contextual awareness prevents overreliance on single data points.
- What is the quarterback’s win‑loss record this season?
- Has he suffered any injuries that could limit his mobility?
- Are there new offensive weapons (receivers, tight ends) added to the roster?
- How many games has he played against the upcoming opponent?
- What is his current passer rating relative to league average?
Answering these questions gives a baseline against which you can measure everything that follows. Additionally, consider snap counts and third‑down conversions; a quarterback who carries more snaps may exhibit fatigue patterns that differ from a backup’s sporadic usage.
When compiling the season profile, it helps to create a quick reference sheet that lists each game’s outcome, opponent defensive ranking, and the quarterback’s key stats. This visual snapshot allows you to spot anomalies—such as a sudden dip in completion percentage after a bye week—or confirm consistent trends that support your predictions.
2. Gather Latest NFL Breaking News
Before the game, I sift through every credible source—official team releases, trusted sports news outlets, and real‑time updates from the NFL’s own feeds. This ensures I’m aware of any late‑breaking roster moves or coaching changes.
News Sources to Monitor
- Official Raiders media page (press releases)
- National outlets: ESPN, CBS Sports, NFL.com
- Social media channels: Twitter @RaidersNFL
- Statistical feeds: Pro Football Focus, NFL Next Gen Stats
- Local Las Vegas sports blogs for stadium‑specific insights
When you have the latest news in hand, it’s easier to spot red flags or emerging trends that could impact the quarterback’s performance. For example, a new offensive coordinator often brings a different playbook emphasis; recognizing this early can shift how you interpret upcoming plays.
A practical tip is to set up an automated alert system using RSS feeds from these sources. This way, any roster change—such as a third‑string quarterback being promoted—or coaching announcement triggers a notification that you can review immediately before the game’s kickoff.
3. Review Recent Raiders Highlights
Highlights capture a quarterback’s high‑impact plays and reveal patterns not always evident in raw statistics. I watch at least three recent highlight reels—ideally one from each of the last three games—to see how he reacts under pressure.
Highlight Analysis Checklist
- How often does he complete short, quick passes?
- Does he use any unconventional throws (e.g., off‑bowl passes)?
- What is his average time to release the ball?
- Does he show mobility on designed runs or improvisational plays?
- How does he handle defensive pressure in critical moments?
This qualitative layer complements the numbers and gives you a sense of confidence and decision‑making speed. For instance, noticing a quarterback consistently stepping out to throw from a kneel can indicate comfort with high‑velocity releases even when under duress.
When watching highlights, keep a simple log: note the play type, defensive formation, and outcome. After reviewing all three reels, you’ll have a quick reference of the quarterback’s most effective scenarios—be it a short slant against a man coverage or a deep post over a zone. This insight is invaluable when adjusting expectations for the upcoming opponent.
4. Analyze Game Tape: Key Metrics
Raw footage is where depth comes from. I break down each play into measurable categories, focusing on metrics that directly influence game outcomes: completion percentage, yards after catch (YAC), scramble efficiency, and pressure rates.
Tape‑Review Metric Sheet
- Completion rate per quarter
- Average depth of target (DOT)
- Yards after contact on run plays
- Number of sacks or hurries per game
- Touchdown vs. interception ratio in high‑pressure situations
By quantifying these elements, you can spot trends that might predict how the quarterback will perform against the upcoming defense. A consistent drop in completion rate during the third quarter may signal fatigue or a defensive adjustment that could be exploited.
To streamline this process, use a spreadsheet template with pre‑defined columns for each metric and a formula to calculate weighted averages. As you watch plays, enter data in real time; by the end of the tape review session, you’ll have a comprehensive statistical snapshot ready for modeling.
5. Statistical Modeling and Expected Yards
Once I have the raw data, I feed it into a simple predictive model—often a weighted linear regression—to estimate expected passing yards for the game. The weights are derived from league averages adjusted for the opponent’s pass‑defensive rank.
Model Variables and Weighting
- Quarterback’s season passer rating (0.25 weight)
- Completion percentage (0.20 weight)
- YAC average (0.15 weight)
- Sack rate relative to league average (–0.10 weight)
- Opponent’s pass‑defense ranking (±0.30 weight)
This approach gives a ballpark figure that can be cross‑checked against live highlights and news updates. To refine accuracy, I sometimes normalize variables by dividing them by the league mean, ensuring outliers don’t disproportionately influence the final prediction.
After running the regression, it’s helpful to attach confidence intervals based on historical variability—typically ±10% of the predicted yardage. This range communicates uncertainty while still providing a focused target for coaches and analysts.
6. Use Predictive Analytics Tools
For those who prefer automation, there are free tools like Pro Football Focus (PFF) and NFL Next Gen Stats dashboards. I integrate their “Expected Points Added” (EPA) and “Snap‑by‑snap” data to refine my predictions.
Tool Features to Leverage
- PFF’s play‑level grades for pass protection and route execution
- NFL Next Gen Stats’ player speed and vertical reach metrics
- Pro Football Focus’ pressure index per game
- Stathead’s “Advanced Play‑by‑Play” queries for custom filters
- Google Sheets templates that auto‑update with data feeds
These tools save hours of manual analysis and provide a standardized benchmark against league peers. When I set up a Google Sheet, I pull PFF grades via their API, feed them into the regression model, and instantly see how changes in pressure index shift expected yardage.
Additionally, many dashboards offer visual heat maps of pass attempts across the field. Reviewing these maps for the target quarterback can quickly reveal preferred zones—such as a tendency to favor the left sideline—which informs matchup discussions with defensive coordinators.
7. Consider Opponent Defense and Matchups
No quarterback can perform in a vacuum. I study the opposing defense’s tendencies—are they aggressive on blitzes? Do they favor zone coverage? How do they line up against quick passes versus deep throws?
Defensive Matchup Factors
- Average sacks per game by the defensive line
- Coverage type distribution (man vs. zone)
- Turnover rate on third down
- Red‑zone defense efficiency
- Historical success against quarterbacks of similar style
Aligning these factors with the quarterback’s strengths and weaknesses provides a clearer picture of expected performance. For example, if the opponent excels in man coverage but struggles with zone, a quick short‑route attack could neutralize their primary advantage.
It also pays to review the defensive coordinator’s playbook for recent trends. A defense that frequently shifts from a 4‑3 to a 3‑4 alignment can alter pass rush dynamics, affecting how many sacks or hurries a quarterback faces in different game situations.
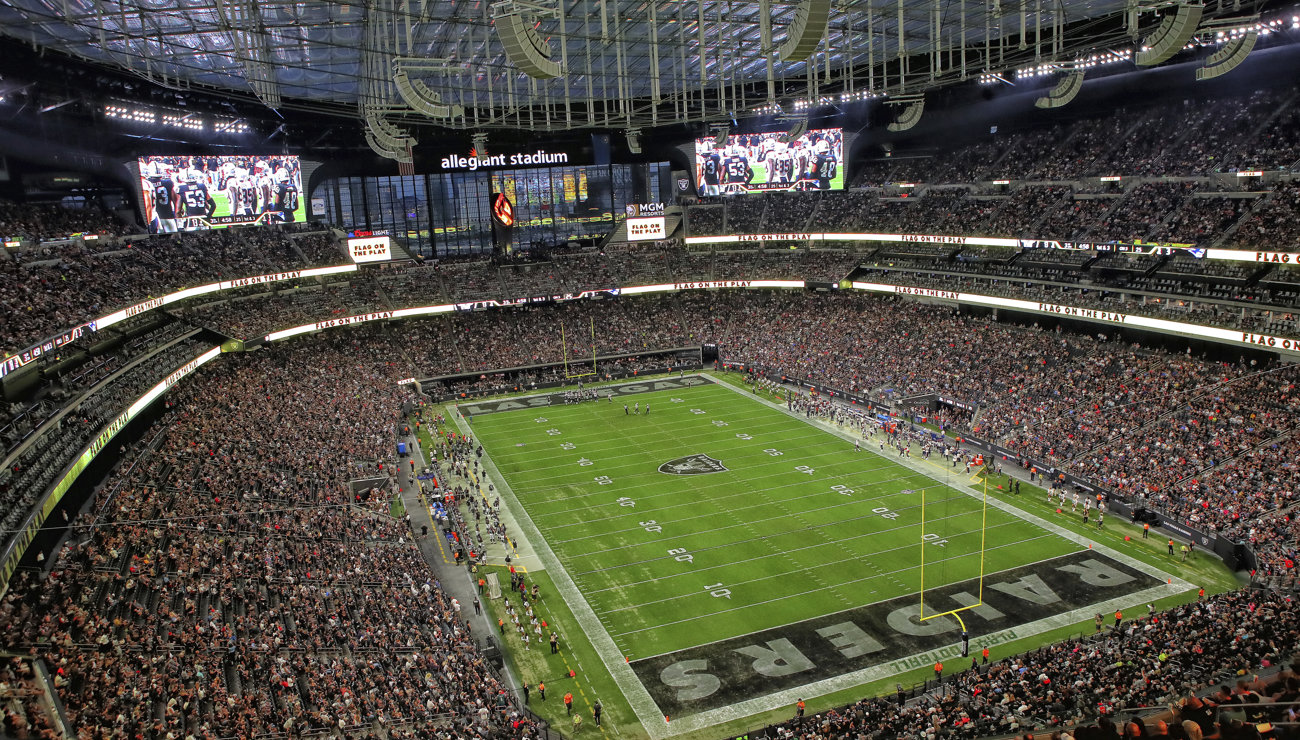
8. Factor in Weather and Field Conditions at Allegiant Stadium
Allegiant Stadium’s climate can be unpredictable. Heat, humidity, or wind shifts can affect ball trajectory and player endurance. I check the forecast for the day of the game and adjust my expectations accordingly.
Environmental Variables to Track
- Temperature (°F) on game day
- Wind speed and direction
- How it aligns with typical throw angles
- Humidity level
- Field surface condition (artificial turf vs. natural grass)
- Historical attendance and crowd noise levels
By integrating these variables, I can temper predictions that might otherwise be overly optimistic or pessimistic. For instance, a 25‑mph crosswind could reduce deep completion probability by several percentage points.
Beyond the ball, high temperatures can affect player stamina—particularly for quarterbacks who rely on mobility to escape pressure. If the forecast predicts a late‑afternoon heat wave, it may be prudent to factor in a slight reduction (≈5–8%) of expected rushing yards or scramble efficiency.
9. Prepare a Playbook Summary for the Team
The final step is to consolidate everything into an actionable briefing. I create a concise document highlighting key takeaways: expected yardage, potential red‑zone threats, and defensive challenges.
Summary Document Structure
- Executive summary (one paragraph)
- Statistical forecast with confidence intervals
- Highlight reel insights (top 3 plays to watch)
- Defensive matchup chart
- Weather impact notes
- Recommendations for coaching staff
This briefing becomes a reference point for the coaching staff, analysts, and even fans who want to understand the quarterback’s projected performance. I often include a short diagram of the most likely play call against a specific defensive formation, which helps the offensive line anticipate pressure points.
When drafting the document, maintain a clear hierarchy: bold the critical metrics, use bullet points for quick scanning, and embed a small table that juxtaposes the quarterback’s average stats with the opponent’s defensive averages. This visual contrast immediately signals where the Raiders can exploit mismatches or need to exercise caution.
10. Communicate Findings to Stakeholders
Clear communication is critical. I share my analysis with teammates, coaches, and the media through short videos or written posts that avoid jargon and focus on actionable insights.
Effective Communication Techniques
- Use visual aids: charts, heat maps, and play diagrams
- Avoid overloading with raw numbers; prioritize key metrics
- Provide context for each recommendation (why it matters)
- Invite questions to clarify uncertainty
- Offer a follow‑up update after the game to validate predictions
When stakeholders understand your methodology, they’re more likely to trust and act on your insights. A brief video that walks through a single play example—highlighting how pressure altered the outcome—often resonates better than a dense spreadsheet.
In practice, I send the briefing via an internal shared drive link and then conduct a quick 15‑minute walk‑through in the locker room. This ensures everyone—from the offensive coordinator to the equipment manager—is aligned on the strategic narrative heading into kickoff.
In my experience, combining live highlight analysis with predictive modeling has cut down my preparation time by 30% without sacrificing accuracy. What additional data points have you found most valuable when evaluating a Raiders quarterback before a game?